Earthworks volumes and digital terrain models

coopergeomatics suds ponds berewood waterlooville

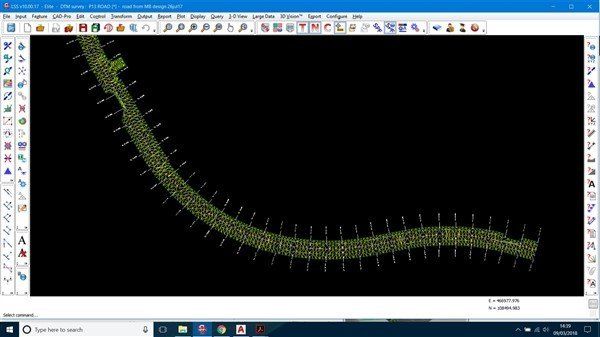
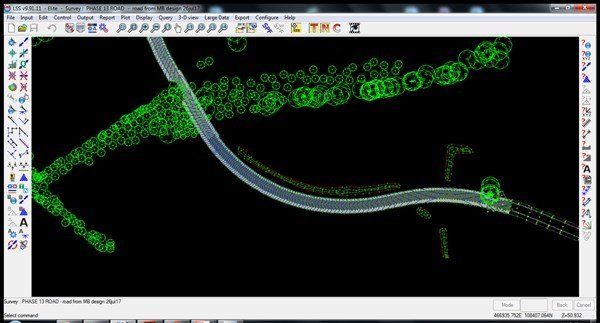
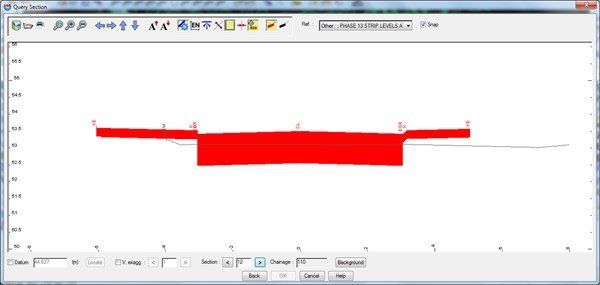
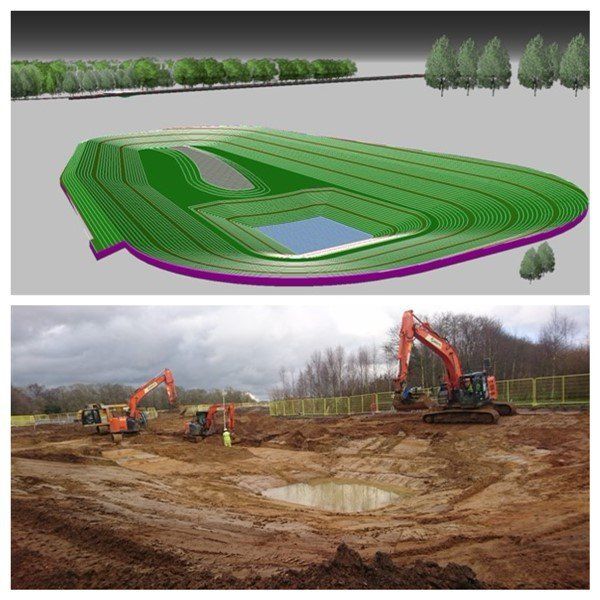
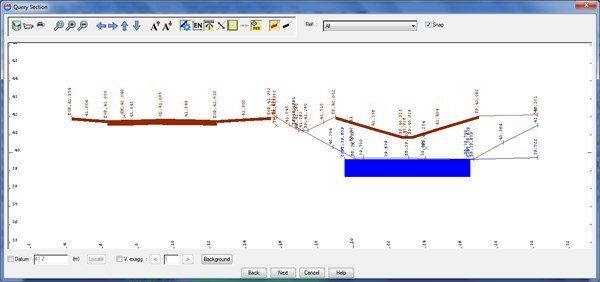
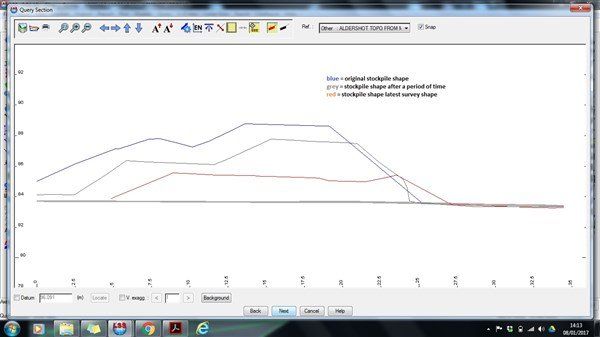
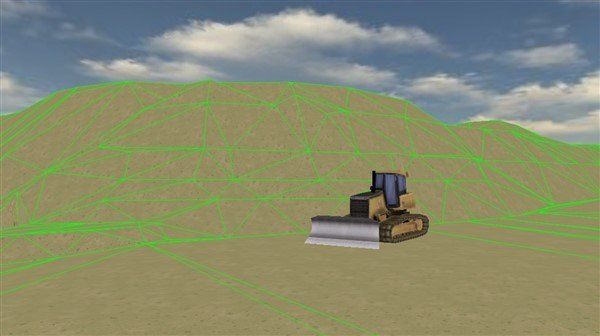
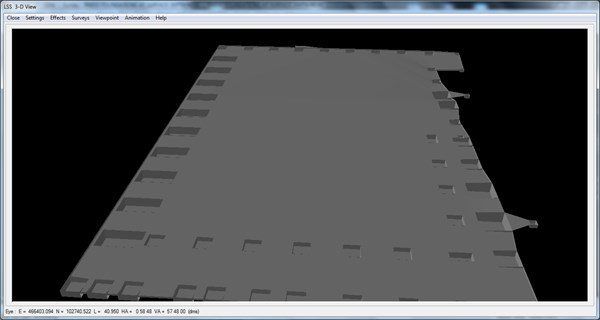
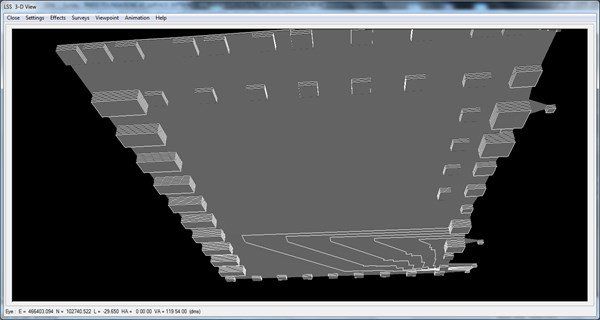
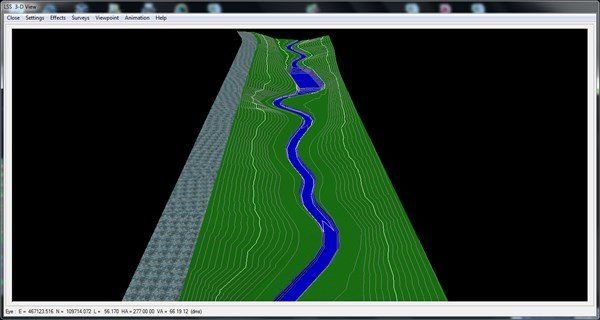
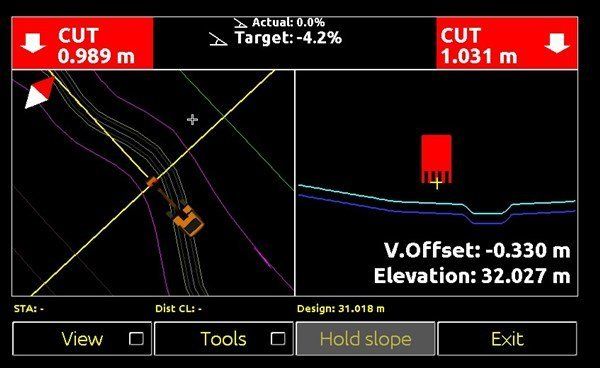
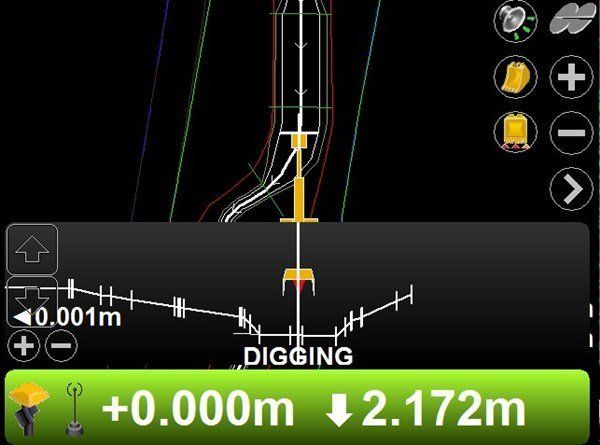
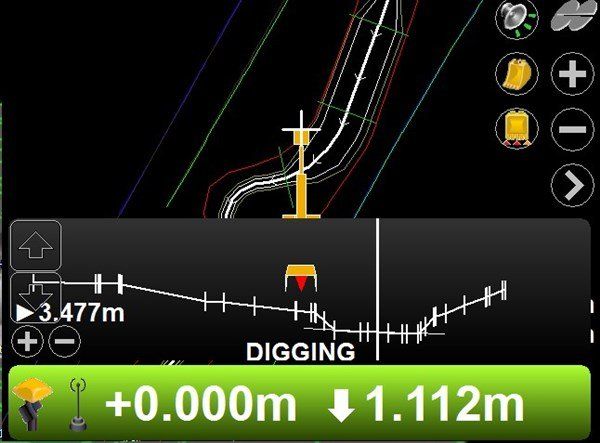
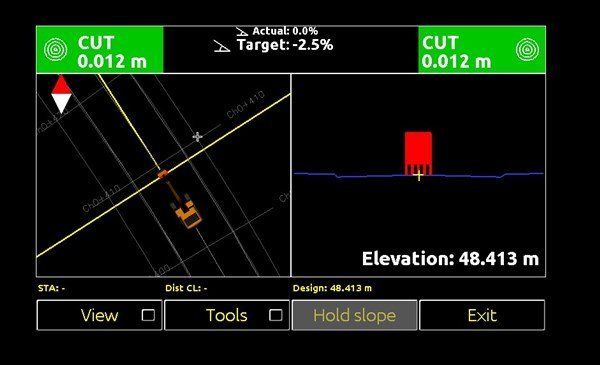
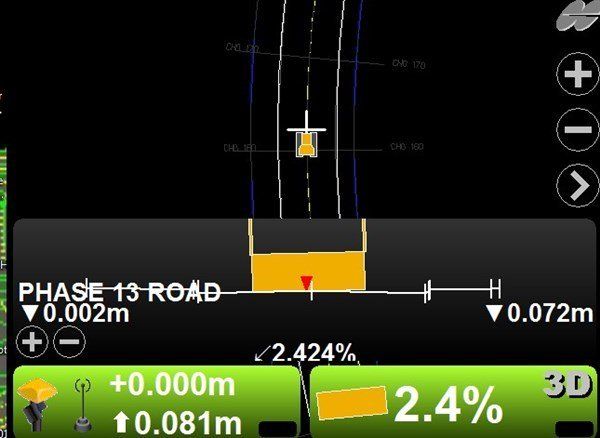
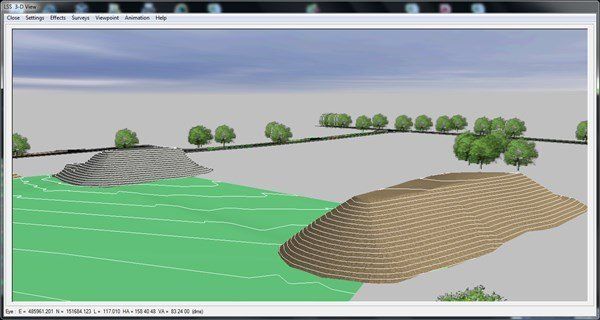
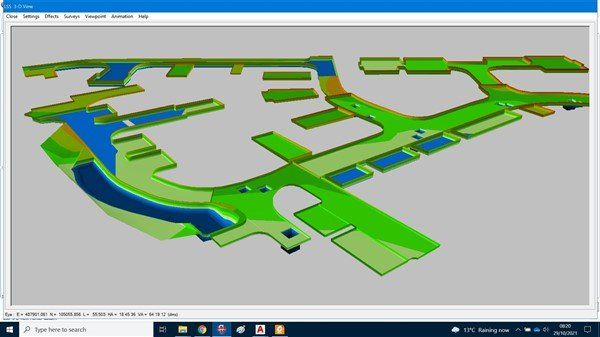
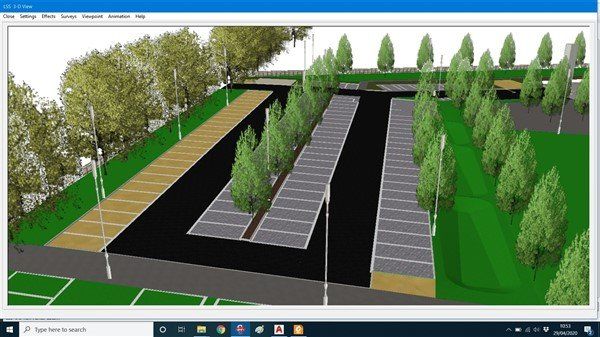
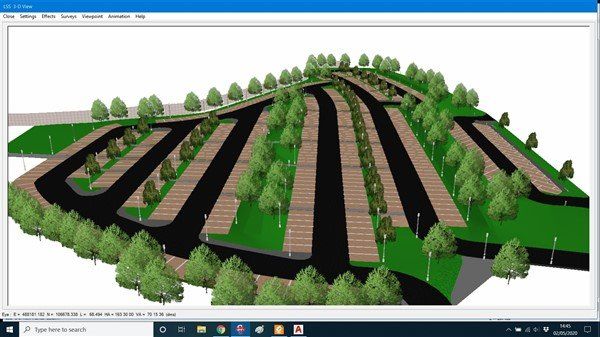
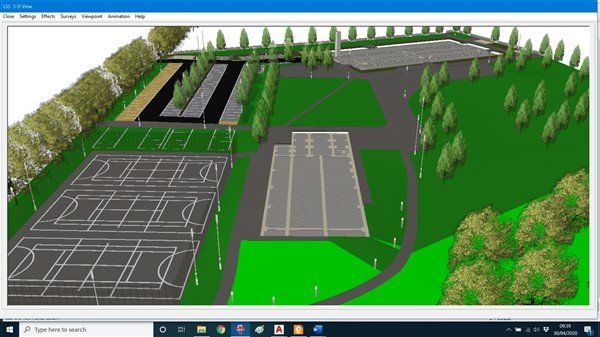
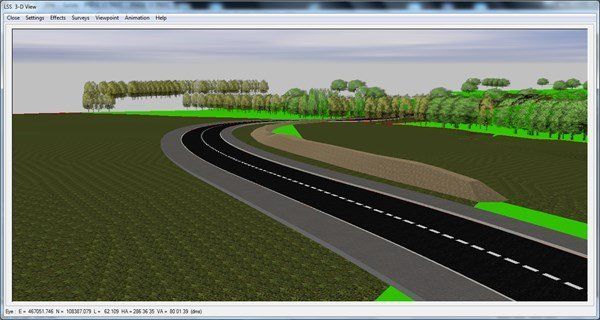
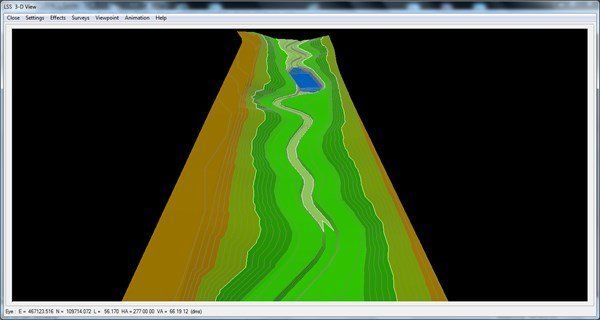
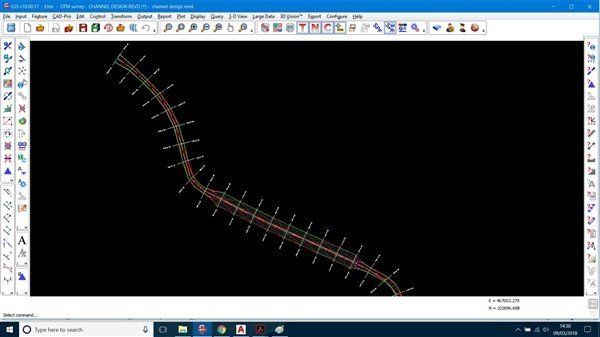
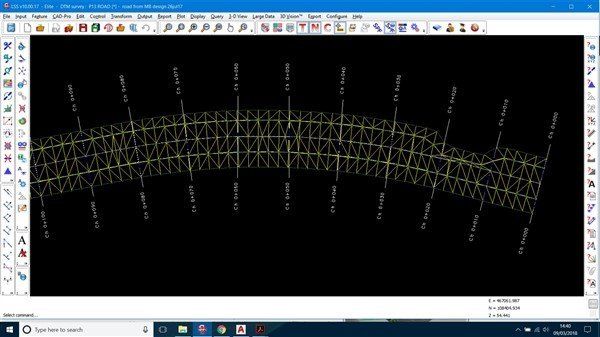
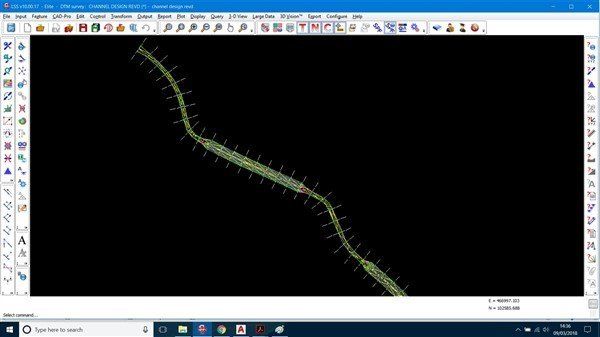
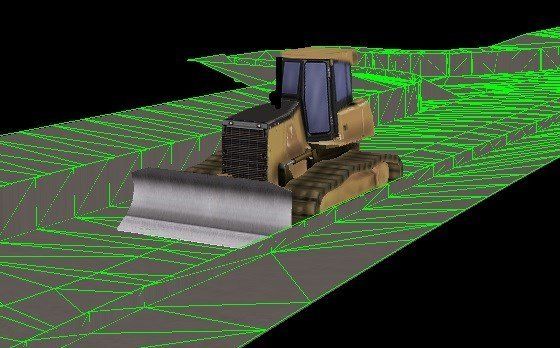
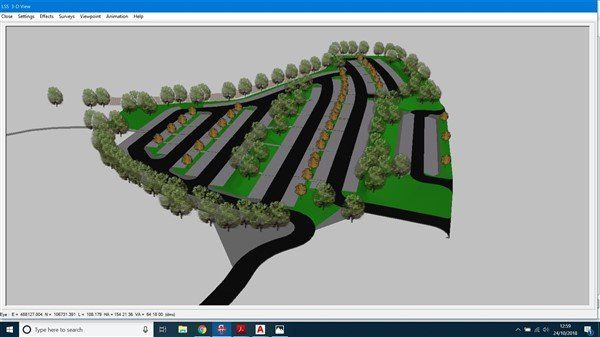
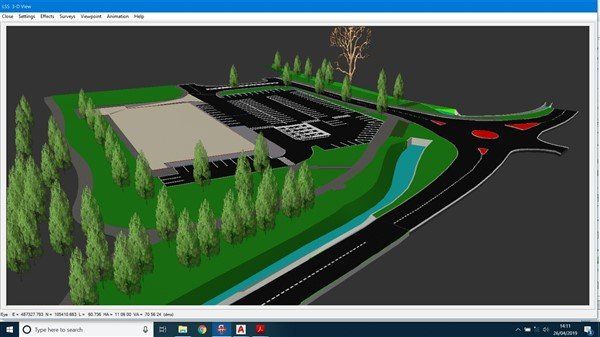
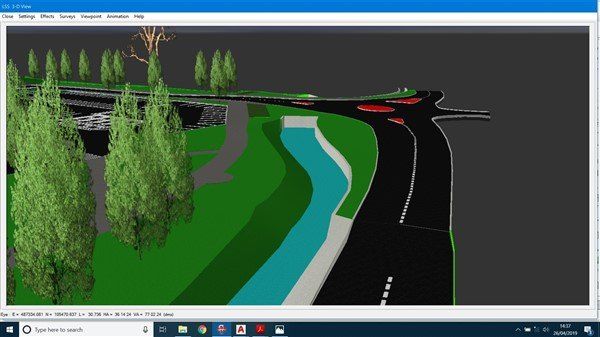
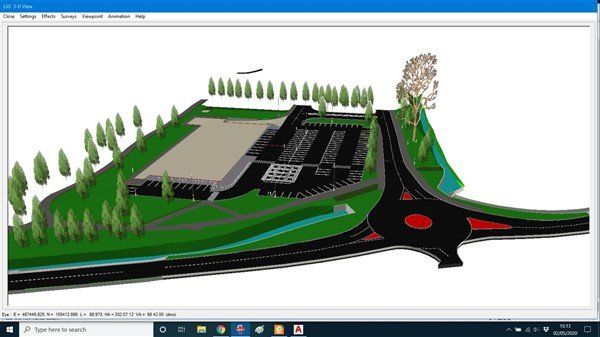
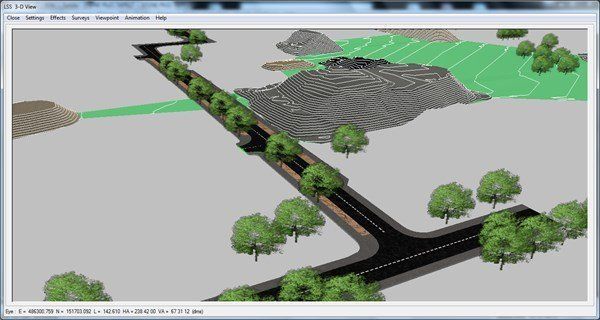
I have been using LSS (a specialised land survey / earthworks / digital terrain model / machine control product) now for 10 years.  I can prepare 3d digital terrain models (dtm), from which I can accurately calculate earthworks volumes (with or without construction depths applied), stockpile volumes, cut / fill, show sections through and enable the dtm to be uploaded to instruments and for machine control. Uploading the DTM onto the instrument means the engineer can accurately answer the question that we are always asked "how much is there to go on / come off here"!!


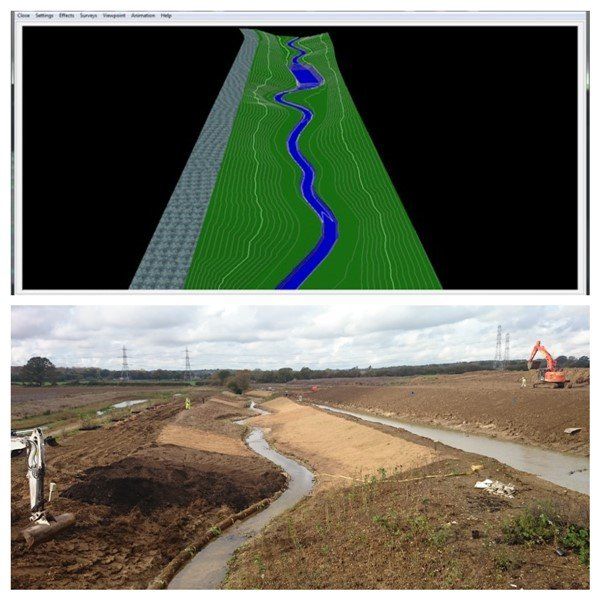
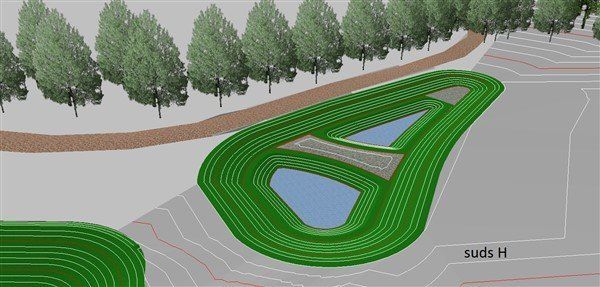
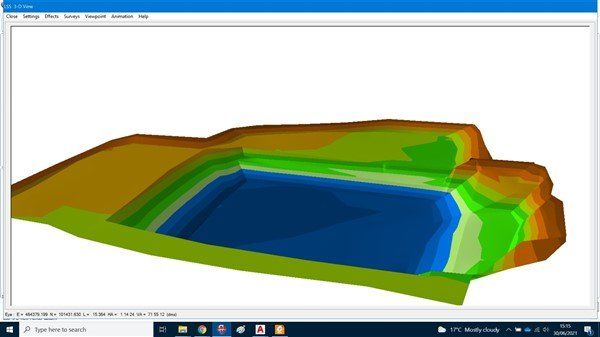
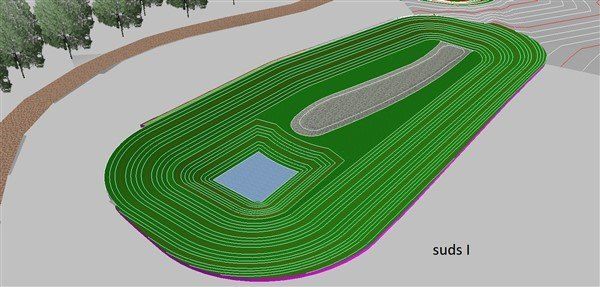
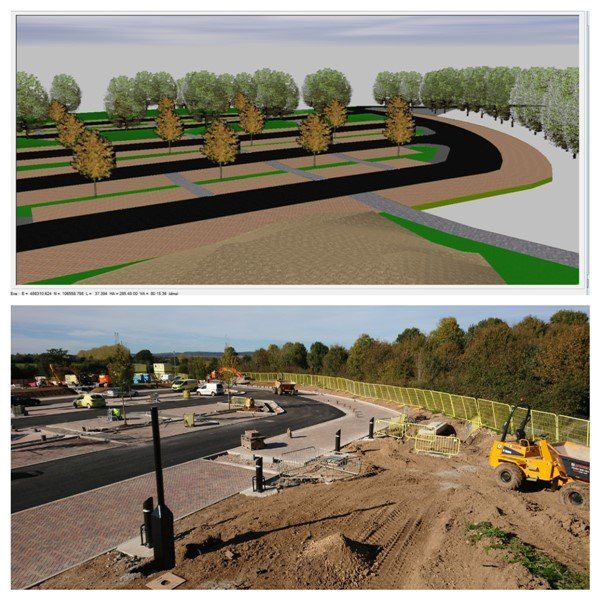
check out berewood suds ponds example here


3d visualisation of a road  

coopergeomatics lss 3d visualisation phase 13 road

The benefits are enormous - very accurate earthworks volumes, cut fill, stockpiles, and creation of the digital terrain model for upload to the instrument. With this I can stand anywhere on the site and tell instantly how much to come off or go on. I can show sections through which I can communicate with site team so everyone can visualise what the designer is trying to achieve. With more sites keeping their arisings on site I can quantify them and work out where they can stored or muck shifted elsewhere, and again survey before and after I can quantify muck shifted for payments etc. I can prepare data files for upload to machine control. I can prepare files for Leica and Topcon machine control systems. By using a combination of LSS, autocad, the Leica Icon Emulator and Topcon 3dOffice I can create, amend and check the integrity of the models and remove any anomolies.


Computer to tarmac

The above images show (L to R). 3d visualisation I created on LSS from the designers info. Topsoil strip. I havent shown the reduced level dig or the soil stabilisation process (just in case you were wondering). Base tarmac.


This image is the LSS survey which I created from the road design strings provided by the designer. In this case the information was given as an excel spreadsheet, edge of footpath,right hand channel, centreline and left hand channel and edge of footpath at 10m intervals. By coding these LSS will join the dots and created the lines. 

coopergeomatics phase 13 road lss 3d visualisation

This image is the 3d visualisation created from the design strings. I have offset the channel lines to get the kerb face and the 100mm upstand. I gave everything a texture and a depth. I even included the topsoil piles!


River restoration

This shows a visualisation of a river restoration and the finished product that I worked on. I created this using LSS from the designers information. This enabled me to upload the  strings and DTM to the instrument.


coopergeomatics stockpile survey

This slide shows the road profile with the construction depths. The grey line is the profile of the exisiting ground level i surveyed after topsoil strip.  By adding my survey of our as built formation levels, top of stone levels etc you can see straight away whether we have given the client what they are paying for.


The top image shows the 3d visualisation of a suds pond we need to dig. The image below it shows progress as we dig . learn more....


Stockpile volumes

I am skilled in the accurate measurement of stockpiles. The old days of pacing round the bottom then guessing the pile is about 3m high are gone. The process is very similar, survey the bottom then the top, however there is some fancy mathematics going on comparing TINs from 2 surfaces zzzzzzzzzzzzzzzz... but anyway the results are very accurate. The data can be provided as a report or a .dxf file for independent verification if required. Graphically the stockpile can be shown as a wireframe or with a surface with surface generated information. see more....
topo with stockpiles
stockpile survey thanks to vince harris

Earthworks reports

Using LSS I can generate earthworks volume reports with or without construction depths applied. It can generate cross sections through which makes it so much easier to visualise what the designer is trying to achieve 

Cross sections and as builts

Once the DTM is created I can provide cross sections through the design and also for as built details.

This is a  section through a road I was involved in showing the relationship between the road and the swale with the suds tank underneath

This is useful when comparing stockpile volumes. I can show the section of the pile on a certain date and then when it has been altered by adding to it or using material from it.

This image shows stockpile useage. By surveying the stockpiles I can demonstate if the pile has has been added to or taken from.

Gallery